Table of Contents
- Most Used Commands
- Gathering Information
- Create New Database
- Create Read Only User
- Inspect
- Moving Schema To Another Database
- Prometheus Exporter
- Top 10 Slow Queries
- Manual User Removal
Most Used Commands
| Command | Description |
|---|---|
\? | Show help on all psql commands. |
\h | Show help on SQL commands (e.g., \h SELECT). |
\l or \list | List all databases. |
\c [dbname] or \connect [dbname] | Connect (switch) to another database. |
\conninfo | Show information about the current connection. |
\dt | List all tables in the current schema. |
\dt *.* | List all tables in all schemas. |
\dv | List all views. |
\ds | List all sequences. |
\di | List all indexes. |
\df | List all functions. |
\dn | List all schemas. |
\du or \dg | List all roles/users and their attributes. |
\du+ | List roles/users with additional details (privileges, memberships). |
\d [table_name] | Describe a table, view, or sequence. Shows columns and types. |
\d+ [table_name] | Describe table with extended info (storage, stats, etc.). |
\dT | List all data types. |
\password [username] | Change a user’s password (prompts securely). |
\timing | Toggle query execution time display on/off. |
\s | Show command history (use \s filename to save it). |
\q | Quit psql. |
\! [command] | Execute a shell command from within psql. |
\x | Toggle expanded table output mode. |
\i [file.sql] | Execute SQL commands from a file. |
\echo [text] | Print text to the output (useful in scripts). |
\set | Show or set internal psql variables (e.g., \set ECHO all). |
\unset [name] | Unset a psql variable. |
\encoding | Show current client encoding. |
\prompt [text] [var] | Prompt for a variable value. |
\watch [n] | Re-run the last query every n seconds (default 2s). |
Gathering Information
List users with SELECT from pg_roles query:
SELECT rolname, rolsuper, rolinherit, rolcreaterole, rolcreatedb, rolcanlogin
FROM pg_roles;
List users only, excluding roles that cannot log in:
SELECT rolname FROM pg_roles WHERE rolcanlogin = true;
List all schemas using a SQL query:
SELECT schema_name
FROM information_schema.schemata
ORDER BY schema_name;
List all databases using a SQL query:
SELECT datname FROM pg_database WHERE datistemplate = false;
Create New Database
CREATE DATABASE mydb;
CREATE USER myuser WITH ENCRYPTED PASSWORD 'mypassword';
GRANT ALL PRIVILEGES ON DATABASE mydb TO myuser;
Optional:
ALTER DATABASE mydb OWNER TO myuser;
Generate a new password:
pwgen -c 22 -y
Create Read Only User
database=> CREATE USER "username" WITH PASSWORD 'password';
database=> GRANT CONNECT ON DATABASE database TO "username";
database=> GRANT USAGE ON SCHEMA public TO "username";
database=> GRANT USAGE ON SCHEMA schema TO "username";
database=> GRANT SELECT ON ALL TABLES IN SCHEMA public TO "username";
database=> GRANT SELECT ON ALL TABLES IN SCHEMA schema TO "username";
Inspect
Measure the database size:
SELECT pg_size_pretty(pg_database_size('DBNAME'));
Measure the database size using psql:
psql -U postgres -d postgres -c \
"SELECT datname, pg_size_pretty(pg_database_size(DBNAME))
 FROM pg_database
 ORDER BY pg_database_size(DBNAME) DESC;"
Calculate the schema size:
SELECT
    n.nspname AS schema,
    pg_size_pretty(SUM(c.relpages)::bigint * 8192) AS approx_total_size
FROM pg_class c
JOIN pg_namespace n ON n.oid = c.relnamespace
WHERE n.nspname = 'SCHEMANAME'
  AND c.relkind IN ('r','m','i','t')  -- tables, matviews, indexes, TOAST
GROUP BY n.nspname;
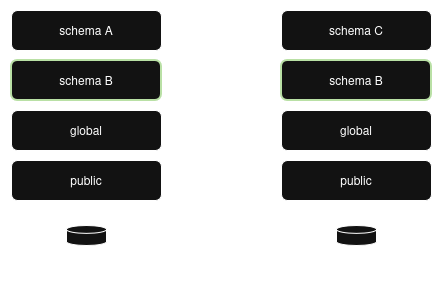
Moving Schema To Another Database
Dump the schema:
PGPASSWORD="..." pg_dump \
  -h dev-server.postgres.database.com \
  -d <database> \
  -U <username> \
  --schema=<schema> \
  --format=custom \
  -v > <schema>.sql
Safety check on prod database:
SELECT schema_name
FROM information_schema.schemata
WHERE schema_name = 'my_schema';
Should return 0 rows before restore.
Plain SQL (.sql file) dumps do NOT support
--schemafiltering on restore!
Preview exactly what will be restored (no DB touched):
pg_restore -l your.dump > restore_plan.txt
Works only for custom, directory or tar dumps.
Make a full production database dump. Start local PostgreSQL test container. Restore production dump into local test container.
docker run -d \
  --name pg_test \
  -e POSTGRES_PASSWORD=postgres \
  -e POSTGRES_USER=postgres \
  -e POSTGRES_DB=postgres \
  -p 5432:5432 \
  -v pg_test_data:/var/lib/postgresql/data \
  postgres:14.19
Ensure PostgreSQL version is the same as on your production server.
docker ps
docker exec -it <CONTAILER_ID> psql -U postgres -d postgres
Check PostgreSQL version:
select version();
Create full production database dump:
PGPASSWORD="..." pg_dump \
  -h prod-server.postgres.database.com \
  -d <database> \
  -U <username> \
  --no-owner \
  --no-privileges \
  --serializable-deferrable \
  -F c \
  -b \
  -v \
  -f full_production_dump.sql
Create new database and new role with all permissions on new database before dump restoration.
Restore production database into local PostgreSQL container:
docker exec -i <CONTAINER_ID> pg_restore -U postgres -d <NEW_DATABASE> --role=<ROLE> -v < ./full_production_dump.sql
Drop schema from database in local PostgreSQL container:
drop schema <SCHEMA> cascade;
create schema <SCHEMA>;
grant usage, create on schema <SCHEMA> TO <ROLE>;
alter schema <SCHEMA> owner to <ROLE>;
Or rename schema:
alter schema <SCHEMA> rename to <OLD_SCHEMA>;
create schema <SCHEMA>;
grant usage, create on schema <SCHEMA> TO <ROLE>;
alter schema <SCHEMA> owner to <ROLE>;
Restore the schema from dump into local PostgreSQL container existing database:
docker exec -i <CONTAINER_ID> pg_restore -U postgres -d <NEW_DATABASE> --schema=<SCHEMA> --role=<ROLE> -v < ./schema_dump.sql
Now you can inspect restored schema:
\dt <SCHEMA>.*
Verify schema size in MB:
SELECT
  nspname AS schema,
  ROUND(SUM(pg_total_relation_size(pg_class.oid)) / 1024 / 1024, 2) AS size_mb
FROM pg_class
JOIN pg_namespace ON relnamespace = pg_namespace.oid
WHERE nspname = '<SCHEMA>'
GROUP BY nspname;
Now if everything is OK - restore this schema to production database:
PGPASSWORD="..." pg_restore \
  -h prod-server.postgres.database.com \
  -d <database> \
  -U <username> \
  --schema=<source_schema> \
  -v <schema>.sql
For PostgreSQL 16+ you can restore schema A as schema B using different name with this option: --schema-map=source_schema:target_schema.
Validate after restore:
\dn
\dt my_schema.*
Enjoy your restored schema!
Prometheus Exporter
helm search repo prometheus-community/prometheus-postgres-exporter --versions
Values configuration:
...

image:
  registry: quay.io
  repository: prometheuscommunity/postgres-exporter
  tag: ""
  pullPolicy: IfNotPresent

...

config:
  datasource:
    host: '<HOST>'
    user: <USER>
    password: '<PASSWORD>'
    port: "5432"
    #database: '<DB-NAME>'
    sslmode: require
  disableCollectorDatabase: false
  disableCollectorBgwriter: false
  disableDefaultMetrics: false
  disableSettingsMetrics: false
  logLevel: "warn"
  logFormat: "logfmt"
  extraArgs: [--collector.stat_statements, --collector.long_running_transactions, --collector.postmaster]
...
Use Helm to deploy postgres exporter release:
helm upgrade \
  --install prometheus-postgres-exporter prometheus-community/prometheus-postgres-exporter \
  --version 6.10.2 \
  -f ./values.postgres.dev.yaml \
  --namespace monitoring \
  --wait \
  --debug \
  --create-namespace
Top 10 Slow Queries
Using bash, curl and psql to query postgres server and redirect slow queries data to loki and prometheus.
Activate pg_stat_statements
For self hosted PostgreSQL services - add this line to postgresql.conf:
shared_preload_libraries = 'pg_stat_statements'
For Azure cloud Flexible Servers for Postgres:
resource "azurerm_postgresql_flexible_server_configuration" "dev_pgcrypto" {
  name      = "azure.extensions"
  server_id = azurerm_postgresql_flexible_server.dev_pg.id
  value     = "PGCRYPTO, PG_STAT_STATEMENTS"
}
Run this in each database you want to monitor:
CREATE EXTENSION IF NOT EXISTS pg_stat_statements;
Now you can select slow queries:
SELECT now(), queryid, calls, total_exec_time, rows, query
FROM pg_stat_statements
WHERE total_exec_time > 1000
ORDER BY total_exec_time DESC
LIMIT 10;
In next two sections you should use deploy Ingress Controller to access both Loki and Prometheus Pushgateway outside Kubernetes cluser. Or you can use Docker image deployed in Kubernetes and use *.namescpae.svc.cluster.local FQDN in URLs.
Sending Slow Queries To Loki
Using Bash script called run.sh we can select slow queries, transform output and upload it to Loki.
#!/bin/bash
echo "[$(date)] Executing PSQL queries and uploading results to Loki..."
This script will be executed in docker container. Define important environment variables.
LOKI_URL=${LOKI_URL:-http://loki.dev.internal:80}
JOB_NAME="pg_slow_queries"
INSTANCE_NAME="$(hostname)"
APP=${APP:-application}
ENVIRONMENT=${ENVIRONMENT:-stage}
PGHOST=${PGHOST:-dev-server.postgres.database.azure.com}
PGPORT=${PGPORT:-5432}
PGUSER=${PGUSER:-username}
PGDATABASE=${PGDATABASE:-dbname}
PGPASSWORD=${PGPASSWORD:-password}
export PGPASSWORD
Ensure you're using replace(replace(query, E'\x1F', ' '), E'\n', ' ') instead of query because huge queries will have special symbols and it will break IFS in bash if there will be no delimiter and line breaks.
QUERY_OUTPUT=$(psql -h ${PGHOST} -p ${PGPORT} -U ${PGUSER} -d ${PGDATABASE} -F $'\x1F' -Atc "
  SELECT now(), queryid, calls, total_exec_time, mean_exec_time, rows, replace(replace(query, E'\x1F', ' '), E'\n', ' ')
  FROM pg_stat_statements
  WHERE total_exec_time > 1000
  ORDER BY total_exec_time DESC
  LIMIT 10;")
Now use while loop to process psql output and curl to upload the date to Loki service:
while IFS=$'\x1F' read -r ts queryid calls total_exec_time mean_exec_time rows query; do
  # Convert timestamp to Unix nanoseconds
	if ! ts_unix=$(date -d "$ts" +%s%N 2>/dev/null); then
		echo "[WARN] Invalid timestamp: $ts — skipping row" >&2
	  continue
	fi
	echo $ts_unix

	# Send logs to Loki
  curl ${LOKI_URL}/loki/api/v1/push -H "Content-Type: application/json" --data-raw "{
    \"streams\": [
      {
        \"stream\": {
          \"job\": \"${JOB_NAME}\",
          \"app\": \"${APP}\",
          \"env\": \"${ENVIRONMENT}\"
        },
        \"values\": [
          [\"$ts_unix\", \"queryid=$queryid calls=$calls total_exec_time=$total_exec_time mean_exec_time=$mean_exec_time rows=$rows query=\\\"$query\\\"\"]
        ]
      }
    ]
  }"

done <<< "$QUERY_OUTPUT"
Sending Slow Queries To Prometheus
Upgrade the script from previous section to transform and upload psql output to Prometheus. Use Prometheus Pushgateway. Exclude query text from metrics and limit payload with queryid only.
PUSHGATEWAY_URL=${PUSHGATEWAY_URL:-http://prometheus-prometheus-pushgateway.monitoring.svc.cluster.local:9091}
Prometheus payload differs from Loki logs, you should create two variables before while loop:
metrics_payload_total_exec_time=$'# TYPE pg_query_total_exec_time gauge\n'
metrics_payload_mean_exec_time=$'# TYPE pg_query_mean_exec_time gauge\n'
Inside while loop add metrics for each queryid with labels:
metrics_payload_total_exec_time+="pg_query_total_exec_time{queryid=\"$queryid\",app=\"$APP\",env=\"$ENVIRONMENT\"} $total_exec_time"$'\n'
metrics_payload_mean_exec_time+="pg_query_mean_exec_time{queryid=\"$queryid\",app=\"$APP\",env=\"$ENVIRONMENT\"} $mean_exec_time"$'\n'
After while loop clean up previous metrics in Pushgateway and upload new payload:
echo "[$(date)] Uploading results to Prometheus PushGateway..."
curl -X DELETE "${PUSHGATEWAY_URL}/metrics/job/${JOB_NAME}/instance/${INSTANCE_NAME}"
sleep 1 # Wait a moment to ensure deletion takes effect
curl -s --data-binary "$metrics_payload_total_exec_time" "${PUSHGATEWAY_URL}/metrics/job/${JOB_NAME}/instance/${INSTANCE_NAME}"
curl -s --data-binary "$metrics_payload_mean_exec_time" "${PUSHGATEWAY_URL}/metrics/job/${JOB_NAME}/instance/${INSTANCE_NAME}"
Create Docker Image
There are several ways of how you can run your script in Kubernetes. Here I will describe so called 'internal cron' approach.
FROM debian:bookworm-slim

# Install necessary tools
RUN apt-get update && \
    apt-get install -y --no-install-recommends \
        postgresql-client \
        curl \
        bash \
        tini \
        cron && \
    apt-get clean && rm -rf /var/lib/apt/lists/*

# Add scripts and cron job
COPY entrypoint.sh /usr/local/bin/entrypoint.sh
COPY run.sh /usr/local/bin/run.sh
COPY crontab.job /etc/cron.d/psql-queries

# Set executable permissions
RUN chmod +x /usr/local/bin/entrypoint.sh
RUN chmod +x /usr/local/bin/run.sh
RUN chmod 0644 /etc/cron.d/psql-queries

# Apply cron job
RUN crontab /etc/cron.d/psql-queries

# Set tini as entrypoint
ENTRYPOINT ["/usr/bin/tini", "--", "/usr/local/bin/entrypoint.sh"]
- I use custom entrypoint script to transfer environment variables into cron environment.
run.shis the bash script from previous two sections.- I need to override default cron signal processing using
/usr/bin/tinito instantly react on SIGTERM in Kubernetes.
Custom entrypoint script called entrypoint.sh:
#!/bin/bash

# Dump the container's environment to a file that cron scripts can source
printenv | grep -v no_proxy > /etc/container_env

# Start cron in foreground
exec cron -f -L 15
Contents of the crontab.job file:
* * * * * /usr/local/bin/run.sh >> /proc/1/fd/1 2>&1
Cron expression meaning:
* * * * * /usr/local/bin/run.sh >> /proc/1/fd/1 2>&1
┬ ┬ ┬ ┬ ┬
│ │ │ │ │
│ │ │ │ └─── Day of week (0-6, Sunday = 0)
│ │ │ └───── Month (1-12)
│ │ └─────── Day of month (1-31)
│ └───────── Hour (0-23)
└─────────── Minute (0-59)
Here >> /proc/1/fd/1 redirects output directly to container stdout, which will be picked up by Docker and Kubernetes log collectors.
And 2>&1 redirects stderr (file descriptor 2) to stdout (fd 1), so both stdout and stderr go to the same place.
Also cron has its own environment and you should load environment variables exported on startup in run.sh script:
[ -f /etc/container_env ] && source /etc/container_env
Build and push docker image to remote registry:
docker build -f ./Dockerfile -t "${CI_REGISTRY}/${REPOSITORY}/${IMAGE}:${CI_COMMIT_SHORT_SHA}" .
docker push "${CI_REGISTRY}/${REPOSITORY}/${IMAGE}:${CI_COMMIT_SHORT_SHA}"
Create Kubernetes secret with postgres password:
kubectl create secret generic pg-slow-queries-stage-secret \
	--namespace <...> \
  --from-literal=password='...'
Create Kubernetes deployment.yaml declaration:
apiVersion: apps/v1
kind: Deployment
metadata:
  name: psql-cron-runner
spec:
  replicas: 1
  selector:
    matchLabels:
      app: psql-cron-runner
  template:
    metadata:
      labels:
        app: psql-cron-runner
    spec:
      containers:
      - name: psql-cron
        image: registry.gitlab.com/.../pg-slow-queries:${IMAGE_TAG}
        imagePullPolicy: Always
        env:
        - name: ENVIRONMENT
          value: "stage"
        - name: LOKI_URL
          value: "http://loki.monitoring.svc.cluster.local:3100"
        - name: PGHOST
          value: "..."
        - name: PGUSER
          value: "..."
        - name: PGDATABASE
          value: "..."
        - name: PGPASSWORD
          valueFrom:
            secretKeyRef:
              name: pg-slow-queries-stage-secret
              key: password
        volumeMounts:
        - name: tmp
          mountPath: /tmp
      volumes:
      - name: tmp
        emptyDir: {}
      imagePullSecrets:
      - name: gitlab-registry-pull-secret
I set IMAGE_TAG environment variable in deployment declaration because later you may want to automate builds using Gitlab or Github Actions. And envsubst will help you to provide actual tag to deployment declaration after each build.
Deploy:
export IMAGE_TAG=${CI_COMMIT_SHORT_SHA}
envsubst < ./deployment.yaml | kubectl --namespace <...> --kubeconfig <...> apply -f -
Enjoy your Postgres slow queries monitoring.
Manual User Removal
DO $$
DECLARE
  s text;
BEGIN
  FOR s IN SELECT schema_name FROM information_schema.schemata
           WHERE schema_name NOT IN ('pg_catalog', 'information_schema', 'pg_toast')
  LOOP
    EXECUTE format('REVOKE ALL PRIVILEGES ON ALL TABLES IN SCHEMA %I FROM username', s);
    EXECUTE format('REVOKE ALL PRIVILEGES ON ALL SEQUENCES IN SCHEMA %I FROM username', s);
    EXECUTE format('REVOKE ALL PRIVILEGES ON ALL FUNCTIONS IN SCHEMA %I FROM username', s);
    EXECUTE format('REVOKE USAGE ON SCHEMA %I FROM username', s);
    EXECUTE format('REVOKE ALL ON SCHEMA %I FROM username', s);
    EXECUTE format('ALTER DEFAULT PRIVILEGES IN SCHEMA %I REVOKE ALL ON TABLES FROM username', s);
    EXECUTE format('ALTER DEFAULT PRIVILEGES IN SCHEMA %I REVOKE ALL ON SEQUENCES FROM username', s);
    EXECUTE format('ALTER DEFAULT PRIVILEGES IN SCHEMA %I REVOKE ALL ON FUNCTIONS FROM username', s);
  END LOOP;
END $$;
REVOKE ALL PRIVILEGES ON DATABASE databasename FROM username;
SELECT classid::regclass, objid, deptype
FROM pg_shdepend
WHERE refobjid = (SELECT oid FROM pg_roles WHERE rolname = 'username');